BRIGHTNESS, CONTRAST, AND BASE SHAPE: WHERE 92,000 COMPUTATIONAL CUTS LAND AGAINST CLASSIC DESIGNS
A quick note: I’m not a trained gemologist. No GIA diploma, no mineralogy degree, and no traditional bench apprenticeship. Just a software engineer who fell down the rabbit hole of faceting machines, geometry, and how light bounces around inside crystals.
A gemstone cut is always balancing two competing demands on the exact same finite budget of incoming light. Brightness measures how much total illumination enters the crown, survives internal reflection across face-up and tilted viewing angles, and returns to the observer's eye. Contrast measures the spatial crispness and dynamic range between bright sky-lit facets and dark viewer head-shadow reflections, which is what produces scintillation ("life" and flash) when the stone moves on a hand.
Maximize raw brightness alone and you get a flat, washed-out white mirror with very little pattern. Maximize dark contrast alone and the stone turns moody and overly extinguished. To show where computational optimization actually lands without drowning you in twenty-four repetitive scatter charts, we measured the entire OffTheDop catalog alongside well-known traditional reference cuts on one shared 3D GPU raytracing scale, normalized so that a classic Diamond Hearts & Arrows round brilliant sits at (1.00, 1.00).
Three clear physical stories emerge from the data: where computational designs sit relative to classic benchmark diagrams, why raising refractive index does not increase brightness forever, and why a stone's base outline shape governs optical performance far more strongly than facet count.
Where Our Cuts Land Against Classic Benchmark Designs
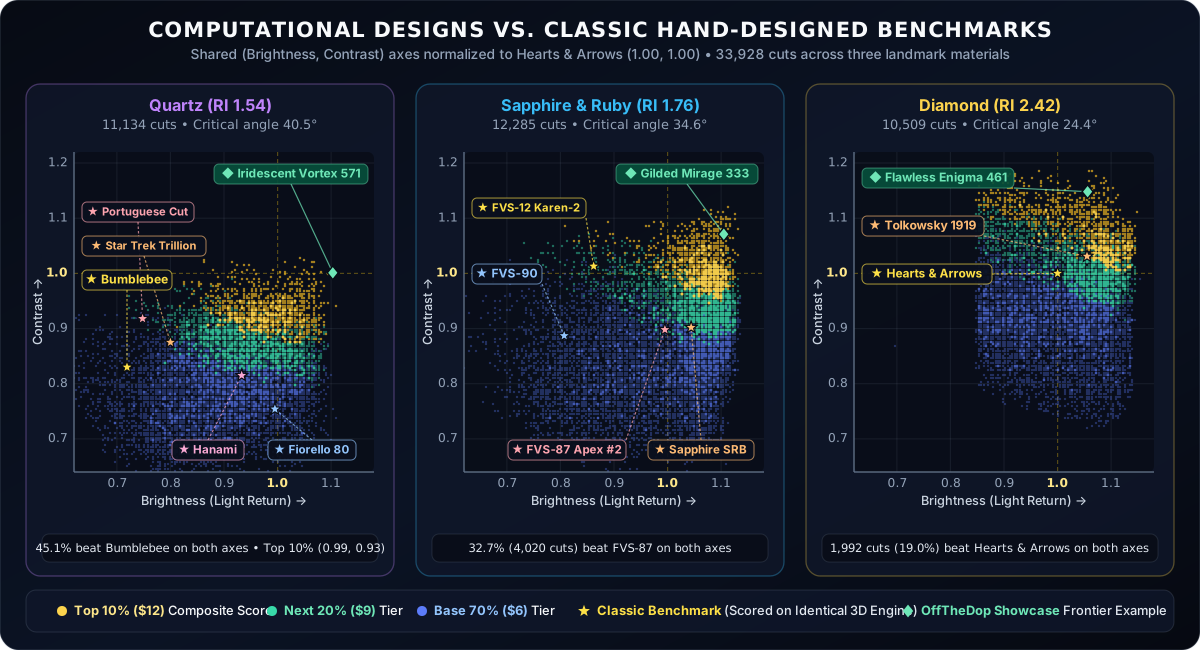
To make an apples-to-apples comparison, we compiled eleven classic public-domain and textbook faceting diagrams into exact 3D polyhedra and ran them through the identical multi-angle GPU optical scorer used across our catalog. Below are three flagship gem materials plotted on one shared Brightness versus Contrast coordinate grid: Quartz (RI 1.54), Sapphire and Ruby (RI 1.76), and Diamond (RI 2.42). Gold stars (★) mark classic reference cuts, cyan diamonds (◆) mark curated OffTheDop Showcase stones on the outer Pareto frontier, and catalog dots are colored by composite performance tier (Top 10% at $12, Next 20% at $9, and Standard at $6).
Look at how differently the cloud and the classic stars behave as refractive index climbs across the three panels:
- Quartz & Amethyst (RI 1.54): With a wide 40.5° critical-angle escape cone, traditional low-RI cuts usually had to sacrifice one axis to rescue the other. Classic Emerald Step cuts leak heavily under tilt; high-facet rounds like the Portuguese Cut build rich concentric contrast at the cost of total light return; and open-table modern brilliants like Fiorello 80 or Hanami push brightness while giving back contrast. By optimizing 3D brightness, contrast, and tilt-window penalties simultaneously, nearly half of our Quartz catalog beats Bumblebee and Fiorino on both axes at once, and over a quarter outscores Hanami on both axes. Frontier Showcase cuts like Iridescent Vortex 571 (
TriCushTr) reach Diamond Hearts & Arrows optical territory inside ordinary rock crystal. - Sapphire & Ruby (RI 1.76): Classic corundum diagrams split along a similar diagonal trade-off. A corundum Standard Round Brilliant and Fred Van Sant's FVS-87 Apex #2 lean toward open brightness, whereas FVS-12 Karen-2 trades brightness for bold dark-bright contrast. Across our corundum catalog, nearly half of designs outscore FVS-90 on both axes and roughly a third beat FVS-87 Apex #2 on both brightness and contrast simultaneously. Our Top-10% Sapphire cuts clear both the Round Brilliant's brightness and Karen-2's contrast at the same time, led by Showcase cuts like Gilded Mirage 333 (
TriTrMir). - Diamond (RI 2.42): Five centuries of empirical diamond polishing already pushed round diamonds remarkably close to the physical ceiling, with Hearts & Arrows defining (1.00, 1.00) and Tolkowsky's 1919 Ideal sitting just above it. Even against that formidable benchmark, nearly one in five designs in our Diamond catalog (spanning rounds, trilliants, cushions, pentagons, and ovals) beats Hearts & Arrows on both brightness and contrast simultaneously, led by Showcase cuts like Flawless Enigma 461.
Why Higher Refractive Index Does Not Mean Higher Brightness Forever
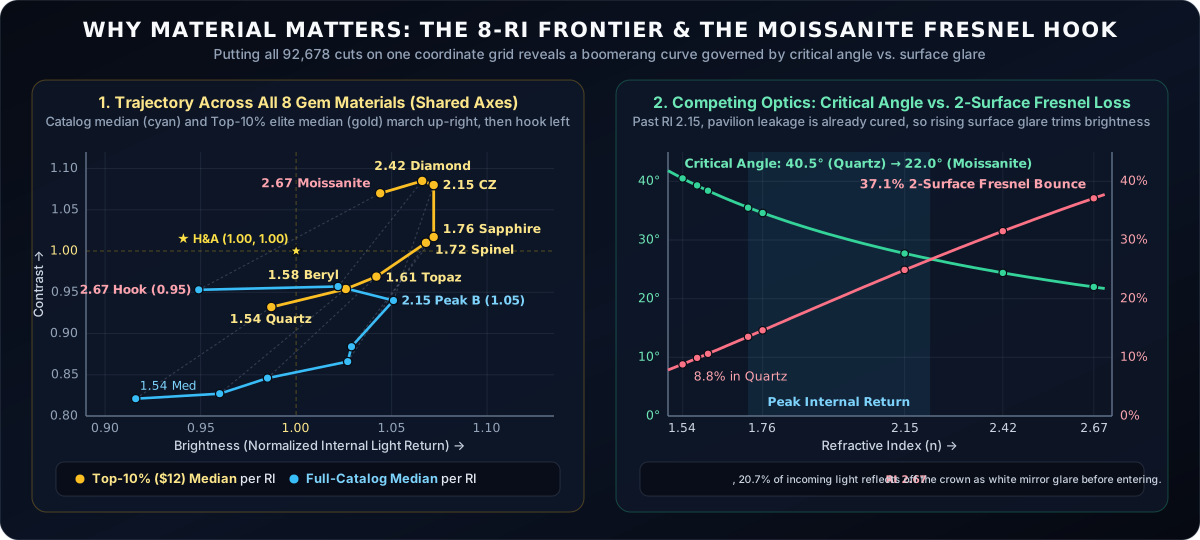
If you plot all eight catalog materials from Quartz up to Moissanite on separate pages, it is easy to miss a striking physical reversal at the top of the refractive index scale. When we place the median trajectories of all eight materials onto one shared Brightness versus Contrast plane, the curve climbs steadily up and to the right from Quartz (1.54) to Cubic Zirconia (2.15), and then hooks leftward at Diamond (2.42) and Moissanite (2.67):
That leftward hook is not an optimizer quirk; it is the direct collision of two fundamental laws of crystal optics:
- From Quartz to Cubic Zirconia, critical-angle shrinkage dominates: As refractive index rises from 1.54 to 2.15, the critical angle shrinks from 40.5° in Quartz to 34.6° in Sapphire and 27.7° in Cubic Zirconia. A narrower escape cone traps far more oblique and tilted skew rays inside the pavilion, lifting both brightness and contrast steadily up to an internal brightness peak in CZ.
- Above RI 2.15, Fresnel surface reflection takes a growing bite: Every ray that enters the crown, reflects off the pavilion, and exits back to your eye must cross two air-crystal interfaces. By Fresnel's law, combined two-surface reflection loss at normal incidence is under 9% in Quartz, rises to roughly a quarter in CZ, passes 31% in Diamond, and reaches 37% in Moissanite. Contrast and spectral fire remain fiercely high in Diamond and Moissanite, which is why high-RI stones throw dramatic mirror-like flashes under spot lighting, yet raw integrated brightness hooks slightly leftward once surface glare bounces over a third of incoming photons off the crown before they ever enter the crystal.
The Base Shape Hierarchy: Why Outline Symmetry Rules Contrast
Cutters often assume that adding more facets is the main lever for changing how a gemstone performs. In practice, across more than 92,000 cuts, facet count barely moves raw brightness between compact 40-facet diagrams and intricate 100-facet designs, while nudging median contrast only gently upward.
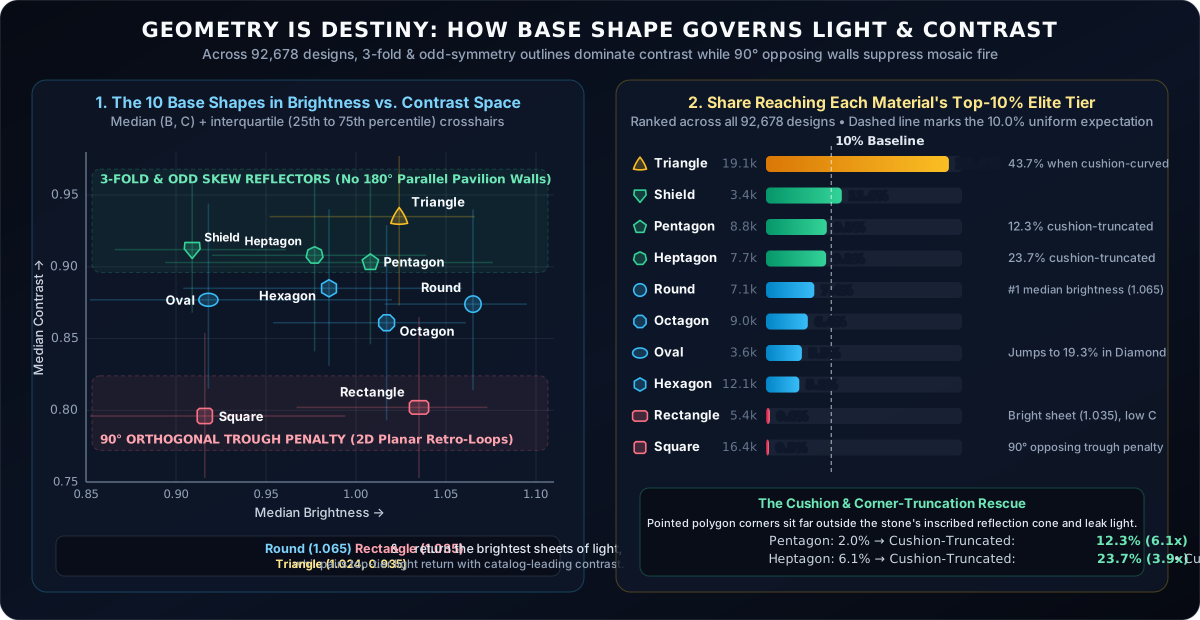
What dramatically separates optical performance is the base outline shape of the stone. Grouping every CAM preform variant across our catalog into its ten fundamental base shapes reveals three distinct optical regimes:
Every pattern in Figure 3 traces directly back to 3D reflection geometry inside the pavilion:
- Odd and non-opposing outlines (Triangle, Shield, Pentagon, Heptagon) rule combined Brightness and Contrast: Triangles capture an extraordinary 28% Top-10% elite yield, nearly triple the catalog baseline, followed by Shields, Pentagons, and Heptagons. In a three-, five-, or seven-fold stone, no pavilion facet ever sits 180° opposite a parallel twin. Instead of bouncing back and forth across a planar trough, rays entering one side cross onto an angled opposite wedge, breaking viewer head-shadow and bright overhead light into high-contrast, edge-to-edge scintillation.
- Rounds and Rectangles lead raw Brightness, with opposite contrast outcomes: Rounds post the highest median brightness in the entire catalog because radial symmetry keeps every pavilion tier at a uniform, optimal distance from the culet. Rectangles rank second in raw brightness, yet fewer than 1% of rectangles or squares reach the Top-10% composite tier. Long 180°-opposing step walls act like efficient roof-prism retro-reflectors, but because entire parallel walls light up or go dark together as a single slab, spatial contrast stays calm and architectural rather than twinkling.
- Cushioning, corner truncation, and refractive index rescue difficult outlines: Within any polygon family, bowing flat walls outward (
*Cush*,*Curved) and chamfering sharp corners (*Tr,*TrMir) breaks up broad planar reflections and starves leaky corner tips. Adding cushion curvature and truncated corners nearly quadruples the elite Top-10% yield of Heptagons (HeptCushTr), multiplies Pentagons sixfold (PentCushTr), and more than doubles Triangles (TriCurvedversusTriTr). Meanwhile, elongated Ovals depend heavily on refractive index: in low-RI Quartz their bowed belly leaks under tilt, whereas in Diamond the tight 24.4° critical angle locks both the ends and waist into total internal reflection, surging Ovals past a 19% elite yield.
Choosing The Right Shape And Cut For Your Rough
Numbers on a scatter plot are not meant to crown a single "winner" shape. A calm, broad-flash emerald rectangle has a completely different job on the hand than a high-contrast cushioned trilliant or heptagon that crackles like crushed ice in candlelight.
What 3D path-traced benchmarking does give you is honest visibility before you touch rough crystal to a diamond lap:
- Cutting low-RI Quartz, Beryl, or Topaz (RI 1.54 to 1.61)? Look closely at cushioned triangles (
TriCurved,TriCushTr,TriTrMir), octagons, pentagons, and heptagons, where non-opposing wedges keep both brightness and contrast high without a dead center window. - Cutting Sapphire, Spinel, CZ, Diamond, or Moissanite (RI 1.72 to 2.67)? The shrunk critical-angle cone opens the door to ovals, rounds, shields, and modified cushions that sustain elite light return and crisp contrast simultaneously.
You can filter over 92,000 designs on OffTheDop by material RI, base shape, brightness, contrast, and cut forgiveness, or inspect any stone's GPU BDPT render, ASET light-return map, and live 3D ray paths before you dop:
Filter Frontier Cuts by Material RI, Base Shape & Optical Metrics
Browse the curated Extended Showcase along the outer Pareto frontier, explore all 10 base outline families, or filter the full catalog by Brightness, Contrast, and 100-run Cut Forgiveness.